
#10: Everything great I've read in the past month
This week: A stream of new vaccines, deaths over the 20th century, how flu became milder, how children reduce crime, how to reduce stomach cancer, and happy capybaras.

This is my tenth post of Scientific Discovery, a weekly newsletter where I’ll share great new scientific research that you may have missed. Check out the About page if you’re interested in why I’m writing this.
I’ve missed a few weeks because of a lot of deadlines in the last month, so this week’s post is a long round up of great new research you may have missed and a new article from me.
New vaccines
There’s been a lot of great news about vaccines this year. Here is a summary.
There’s a new dengue vaccine, which the EMA’s advisory committee has recommended to be approved soon. It’s estimated to cut the risk of dengue fever by 61% and hospitalisation by 84%.
This is big news. Only one other dengue vaccine has ever been approved, and it carried serious risks for some people: it showed ‘antibody-dependent enhancement’ which meant that, while it was effective at reducing reinfections, it worsened the disease for people who had never been infected before.
This new vaccine doesn’t show that.
In case you didn’t know, dengue fever has been growing over the years. Its prevalence has almost doubled over the last three decades – from an estimated 30 million infections in 1990, to 57 million in 2019. The rise is probably due to urbanization, travel and changing mosquito habitats.
There’s a new malaria vaccine, which cuts the risk of clinical malaria by 70–80% a year after a booster dose.
It’s hard to overstate how big of a deal this is. Malaria kills hundreds of thousands of people every year. In the meantime, people have also developed other interventions, like insecticide-treated bednets, but I think vaccines are easier to scale and their benefits are more long-lasting.
The only other malaria vaccine, which was approved last year, had an efficacy of around 30% after 4 years. Both were initially tested in challenge trials, and I plan to write about them more later.
There are several new RSV vaccines in the works, as I’ve written about before. Two are likely to be approved soon, for the elderly. Both reduce the risk of disease by 80–85%. RSV is a leading cause of death in infants and the elderly, and so the next step is for these vaccines to be refined and approved for children.
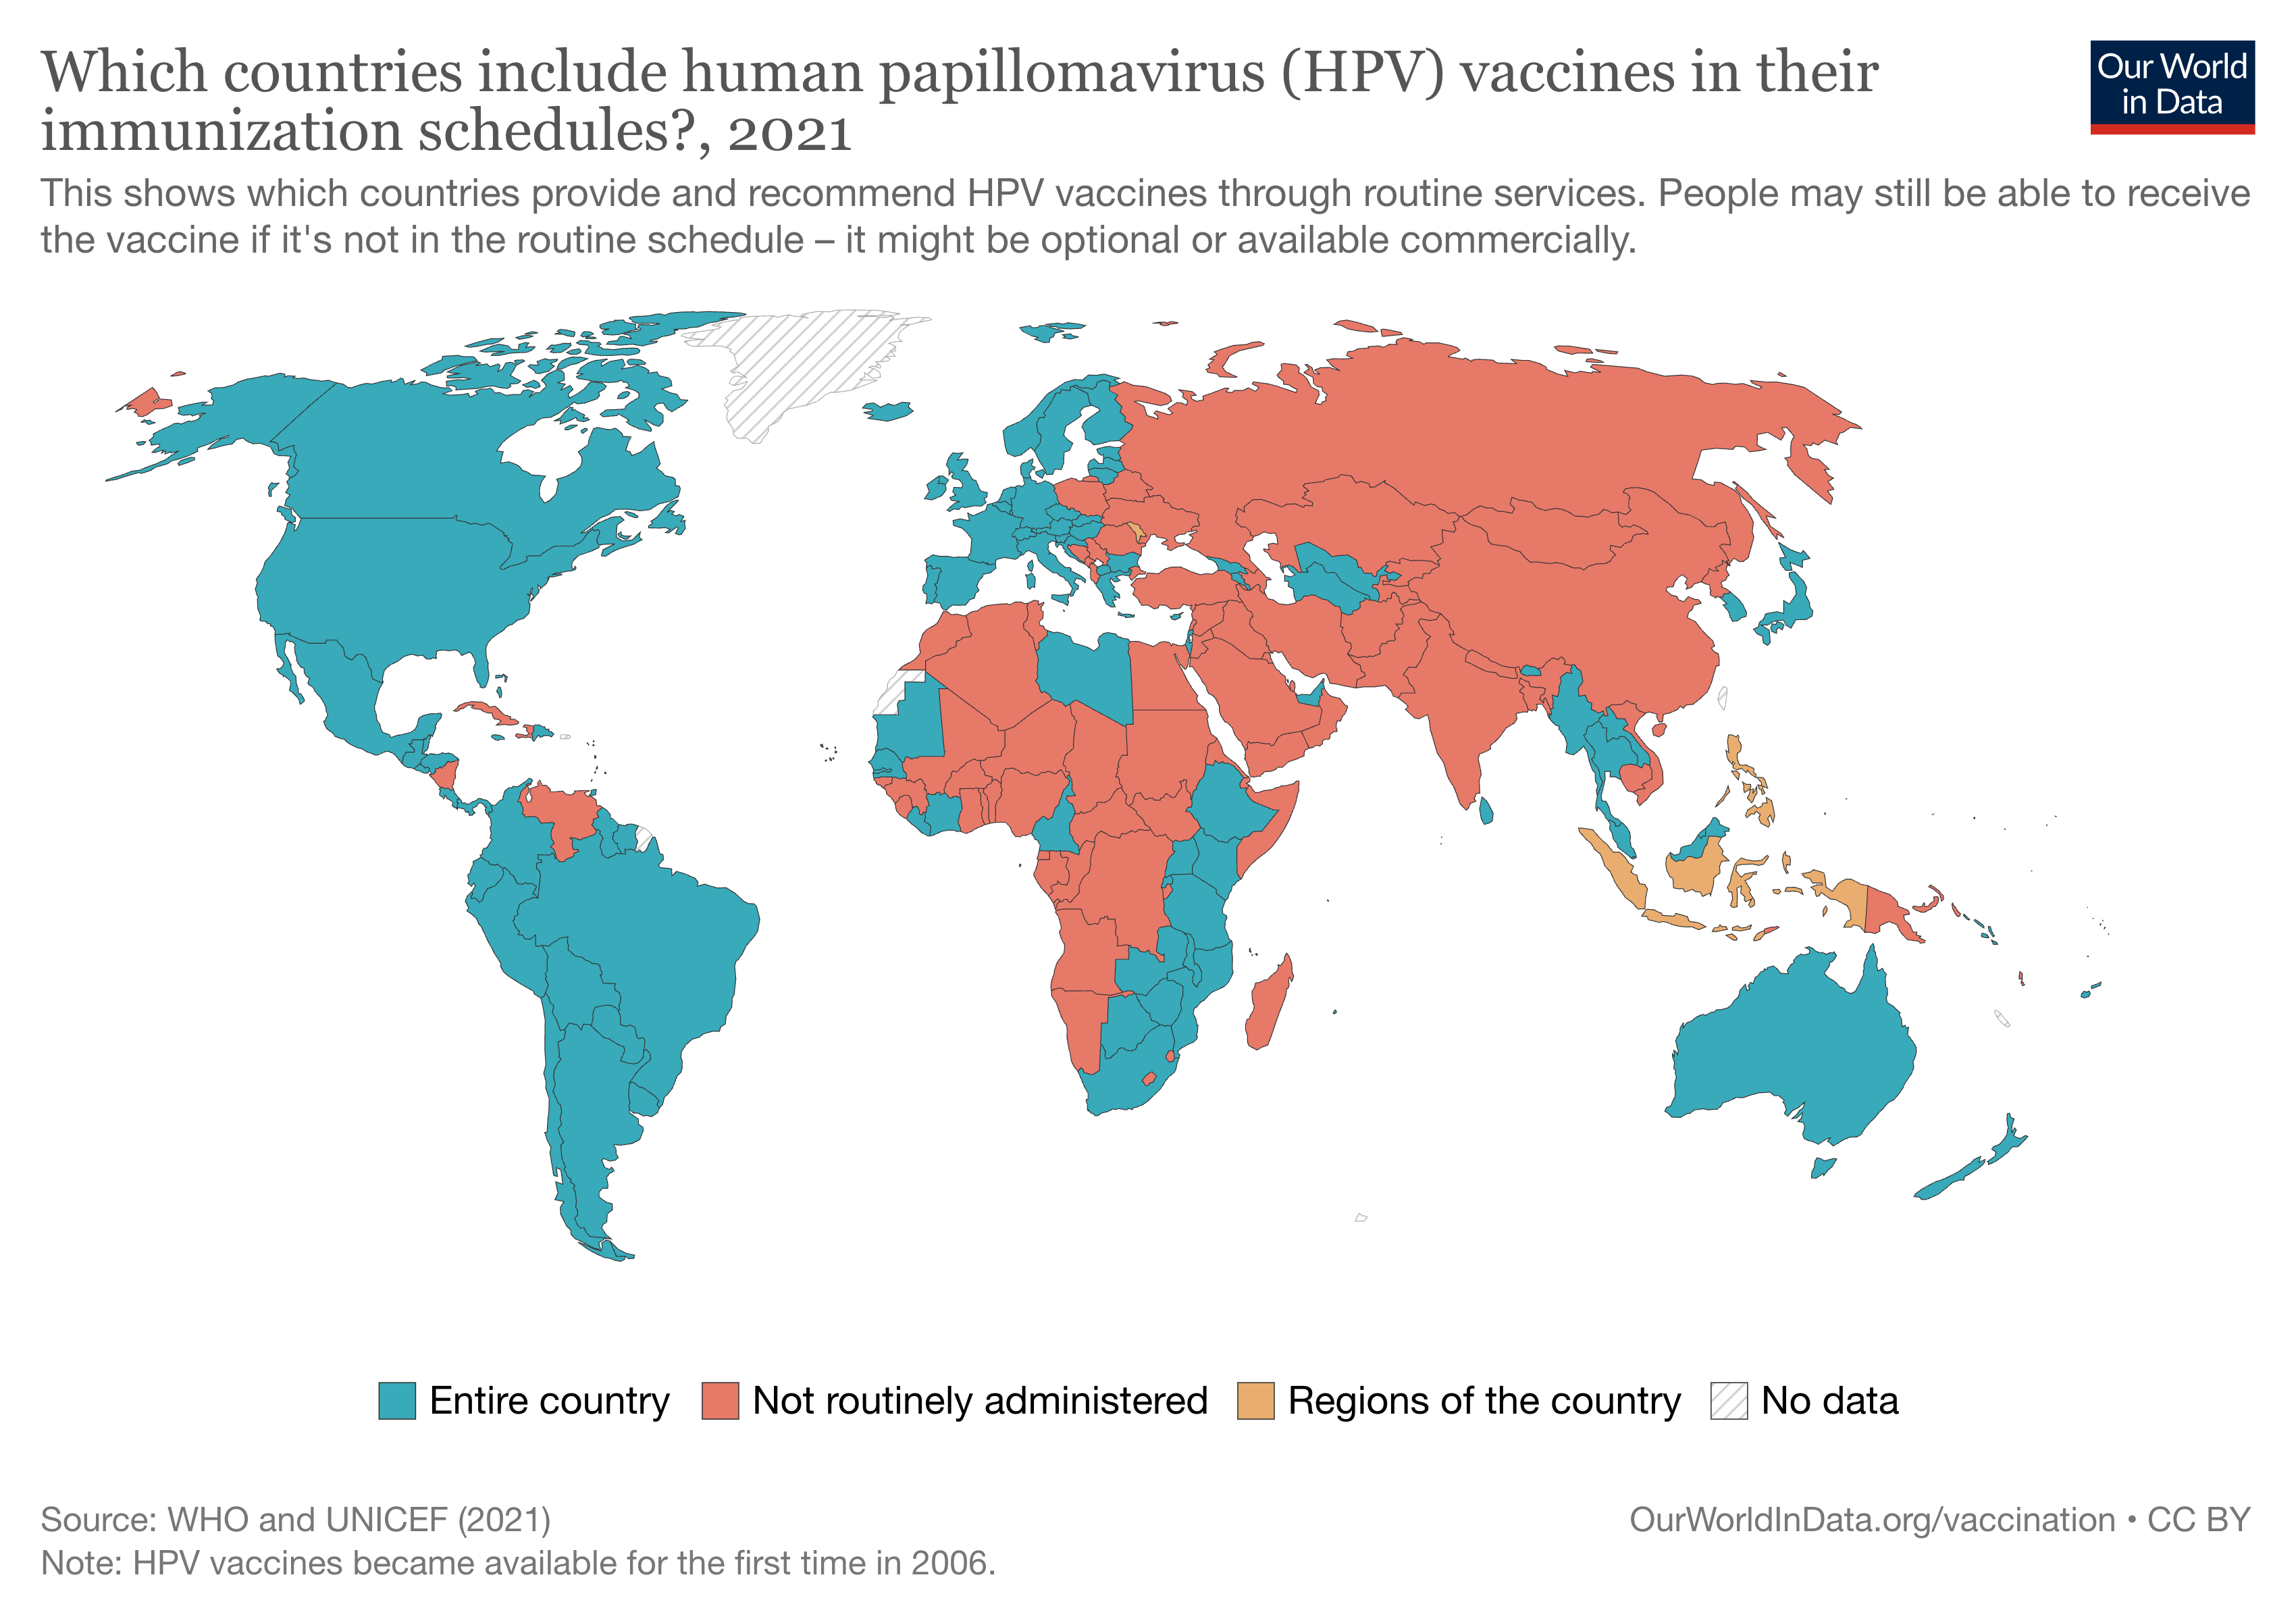
There’s a new HPV vaccine, which cuts the risk of several cancers including cervical cancer, as I’ve written about before. HPV vaccines were first made available in 2006. This new one, developed by the Serum Institute of India, is intended to be low cost to supply low-income countries. That’s really important because many countries around the world don’t currently provide HPV vaccines in their routine services, and part of the reason they don’t is their price.
Mortality over the 20th century
Study: Methods for disentangling period and cohort changes in mortality risk over the twentieth century (Jones, Minton and Bell, 2022)
Now here is a really cool chart on deaths over the 20th century, in England and Wales.1 What it shows is how some years had mortality ‘shocks’, i.e. sudden rises or falls in deaths.

The vertical lines on this chart show ‘period effects’, which are mortality shocks that affect lots of people, at a given time.
Examples of this are the two World Wars and Spanish flu in 1918, which were both particularly deadly for young and middle-aged adults, during those years. The World Wars show up as big red vertical splodges for men.
The diagonal lines show ‘cohort effects’, which are generational effects that carry forward as people age. These are caused by experiences that people had from growing up at a particular time.
You can see, for example, a clear red diagonal line from around 1918. This line shows that people born during the Spanish flu pandemic had much higher risks of death across their whole lifetimes than people born just before or after it.
The paper has many other interesting insights too.
How flu became milder
Article: How many people die from the flu? (by me for Our World in Data)
Flu is much less severe than it used to be. People born more recently have much lower risks of dying from flu, after accounting for their younger age and events that caused shocks across age groups. In other words, this is also an example of a ‘cohort effect’.

Researchers can estimate these effects because the US has detailed weekly death data going back many decades, and it’s broken down by age. Also, flu deaths rise during the winter, which makes it easier to distinguish them from other trends going on across years.
So, what caused the decline in flu severity? A combination of several big changes. One was that large sanitation projects were set up across cities in the US at the beginning of the 20th century. Another was that there was a gradual rise in many childhood vaccines, which protected people from developing co-morbidities which would make them vulnerable to the flu later on. A third was improvements in healthcare, especially for newborns and infants.
And a fourth reason was, of course, flu vaccines. Flu vaccines were first developed in the 1930s and 40s, which seems surprisingly recent. That’s because the influenza virus was only identified in 1933. Since flu shared symptoms with many other diseases, scientists had previously thought it was caused by bacteria like haemophilus influenzae (which is named that way precisely because of that confusion).
By the way, if you live in the northern hemisphere, now is a good time to get a flu shot and help your older relatives get it too. Flu is back this year, and this year’s strain tends to be more severe. Flu vaccines give you protection from them and thereby reduce the risk of heart attacks and strokes.
Everything else
When people have children, they become less likely to commit crimes (Massenkoff & Rose, 2022). This study shows this is the case for both fathers and mothers. It is the case for intended and unintended pregnancies, for stillbirths, during pregnancy, and after childbirth, and especially for first-time parents.

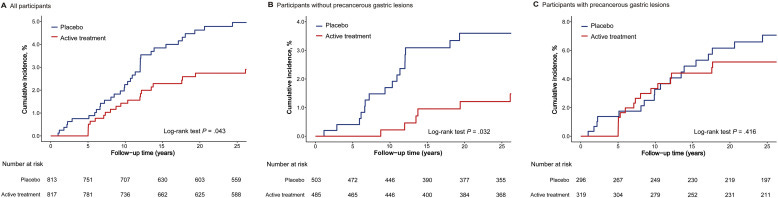
If you are infected by H. pylori, getting treated for it reduces your risk of developing stomach cancer by around 43% over the next 20 years – even if you don’t have symptoms (Yan et al., 2022).2 Notably, H. pylori is the most cancer-causing pathogen we know of.
It cost $60 million to get the sequence of a single human genome in 2002. That figure has plummeted over the years. This year, new technology means it will cost $200.
It’s common to see large racial disparities during epidemics. But during Spanish flu, these disparities actually narrowed in the US (Eiermann et al., 2022). The authors test many different hypotheses for why this might be, and it seems the strongest explanation is ‘imprinting’: that white Americans had more exposure to H3 strains during the 1889 Russian flu pandemic, which made them more susceptible when the new H1N1 Spanish flu strain spread in 1918. (This is also a cohort effect.)
Capybaras are very comfortable in hotsprings (Inaka and Tomura, 2021). I couldn’t not include this table from the paper. Look at how content they are!

Over the last two decades, deaths by suicide have been increasing in teenagers in the US, and this study looks at how these trends vary by method (Joseph et al., 2022).
Using antidepressants during pregnancy doesn’t increase the risk that children will develop developmental disorders (Suarez et al., 2022). This is a very useful analysis. You usually see a correlation between them because of confounding: mothers who use antidepressants are more likely to have developmental disorders, which their children could inherit from them. But this study has a huge sample and looks at data within families – e.g. when mothers used antidepressants during one pregnancy but not another – which means it can avoid many sources of confounding like this.
This chart on mammal populations, by my great friend and colleague Hannah Ritchie, kind of blew my mind.

Hilda Bastian has a very moving and informative article on the lack of evidence behind ‘the five stages of grief.’ I’m not surprised that there’s very little basis for them. But most people experience grief at some point in their lives, and it’s sad that we don’t have better answers about what they can expect and how to make it easier.
Three new Covid vaccine studies:
Getting a Covid vaccine during pregnancy reduces the risks of fetal death and newborns needing ICU treatment (Watanabe et al., 2022). I wrote about the risks of Covid during pregnancy last year.
Talking to a chatbot for five minutes increases people’s willingness to get a Covid vaccine (Brand and Stafford, 2022). There are other simple ways to increase coverage too, as previous research has found that sending text message reminders and bookings increased vaccination uptake.
After vaccines became available, Republicans in the US became more likely to die from Covid than Democrats, who had higher vaccination and booster rates (Wallace, Goldsmith-Pinkham & Schwartz, 2022).
A 1984 Danish reform, that gave parents an extra month of parental leave, led to improvements in their mental health later on – with “2.4 fewer psychiatric diagnoses within 5 years per 1000 women giving birth, which corresponds to one psychiatric diagnostic potentially prevented for every 416 women eligible for the parental leave extension.” (Courtin et al., 2022) The effects were larger among low-income and less-educated women. These were bigger effects than I expected, and they are clear evidence of how people's circumstances can affect their mental health, even while mental illnesses are also influenced by genetics. The national registry used by the authors of this study is unusually useful for research because it is massive and has detailed data, where researchers can look at diagnoses and socioeconomic demographics at the same time.
Matt Clancy has a great new post on teams that work remotely. It explains how, over time, remote work has improved and become better at encouraging teamwork and innovation.
This was a great interview about the ‘hygiene hypothesis’ by Caitlin Rivers. I’ve recently been unsure about where the scientific consensus stands on this topic, and I found this very informative.
“The first freshwater angelfish genome was just published by a high schooler using a MinION to sequence the DNA of his dead pet.” (Madireddy, 2022) h/t Rich Abdill. This is a good paper on its own merits and the code is on GitHub, which is impressive, and it adds to my view that younger generations are going to be just great.
More links
We released a new issue of Works in Progress inspired by the book Where Is My Flying Car? – which asks why many inventions that people hoped for didn’t materialise and explores ‘the great economic stagnation’ and its causes. The special issue of Works in Progress is a collection of essays on themes in the book.
My colleague Nick Whitaker deserves a lot of credit for putting this fun issue together.
Everything in the issue is worth reading, but what I found most inspiring was a piece by Ben Reinhardt on what the future of energy could look like.
My favourite blogger Bartosz Ciechanowski has a new post on how sound works, which has many fun animations and interactive parts.
The new photos from the Webb telescope are just really cool. This photo below is of Neptune and its rings.

From NASA’s Webb Telescope. My great colleague Edouard Mathieu, who played a big part in assembling global Covid data at Our World in Data, was interviewed about his experience on the podcast Hear This Idea.
I listen to the podcast Ukraine: The Latest almost every day. It’s a very informative summary of the news and how to interpret it, which I find hard to do on my own with snippets on Twitter.
If you’re looking for new TV to watch, I really enjoyed the series The Bear on Hulu/Disney plus. Every episode feels cinematic. And I recently watched the film All the President’s Men (1976), which was also very good. But the best series I’ve watched this year was Invincible.

And lastly, I was on Vox’s Future Perfect list of 50 people making the future better. They wrote a very kind profile of me, which is filled with things I aspire to be & aim to live up to.
I hope you enjoyed this post, and share some fun facts you’ve learnt here with your friends, and subscribe if you haven’t already :)
See you next time!
– Saloni
p.s. I have a few big articles coming up soon, so keep a look out for them!
Correction: I previously wrongly wrote that this chart showed data across 40 countries. Instead, it shows data from only England and Wales. The rest of the paper has analyses from across 40 countries.
See also this larger earlier meta-analysis, showing similar or higher efficacy.
The graph on the cohort effect of the Spanish flu is fascinating!
"You can see, for example, a clear red diagonal line from around 1918. This line shows that people born during the Spanish flu pandemic had much higher risks of death across their whole lifetimes than people born just before or after it."
Do we know if the effect is due to, e.g., babies being born to mothers who had the flu, or babies having the flu in their first year, or just the general unhealthy environment in their first year? I guess I am surprised to see an effect that is so much stronger for those born in 1918 compared to those born in 1917?
epic